Lateralizing Cortical Excitability in Drug Naïve Patients with Generalized or Focal Epilepsy
Article information
Abstract
Background and Purpose:
Numerous transcranial magnetic stimulation (TMS) studies have defined the characteristic features of TMS in epilepsy. TME parameters were expected to classify the epilepsy syndrome or drug responses. However, the results such as cortical silent periods (CSP) are variable according to conditions of patients. Here, we investigate whether specific TMS parameters have localizing or lateralizing values in drug-naïve epilepsy patients.
Methods:
We recruited 148 consecutive untreated patients with epilepsy (idiopathic generalized epilepsy (IGE) 38, focal epilepsy (FE) 110, mean age 31.4 years) and 38 age- and gender-matched normal subjects. We obtained resting motor threshold (RMT), motor-evoked potential (MEP), CSP, short interval intracortical inhibition (SICI, inter-stimuli interval 2–5 ms), and intracortical facilitation (ICF, inter-stimuli interval 10–20 ms). TMS were performed during a seizure-free state of more than 48 h.
Results:
In IGE, no interhemispheric difference in CSP was found (p > 0.05). However, the mean CSP was longer in IGE patients than in normal controls at all stimulus intensities (p < 0.05). The mean CSP in ipsilateral hemisphere (IH) of FE was significantly longer at all stimulus intensities than that in normal controls (p < 0.001). The CSP in IH was longer than that in the contralateral hemisphere of FE. There was no significant difference in CSP between FE and IGE. SICI was significantly reduced only in the IH of FE versus normal subjects. RMT, MEP amplitudes, and ICF did not differ among IGE, FE, and normal controls.
Conclusions:
We found that prolonged CSP and reduced SICI in FE indicate asymmetrically increased cortical inhibition and excitation in the epileptic hemispheres. It suggests that CSP among TMS parameters has a crucial role to lateralize the epileptic hemisphere in FE.
Introduction
Epilepsies are syndromes characterized by heterogeneous and dynamic processes leading to an altered balance between excitatory and inhibitory influences at the cortical level.1 transcranial magnetic stimulation (TMS) has evolved as a non-invasive and useful tool to investigate cortical physiology and excitability in vivo over more than 20 years.2–6 TMS is based on the extracranial application of time-varying magnetic fields, which penetrate the skull in a painless manner and result in the trans-synaptic excitation or inhibition of pyramidal neurons. TMS can be used to elucidate the physiology and the excitability of the motor cortex, which has also been used in different epileptic syndromes to investigate the localization of epileptic foci, changes in cortical excitability, and the effects of antiepileptic drugs (AEDs). The motor-evoked potential (MEP) is recorded from target muscles after stimulation of the primary motor cortex by TMS. TMS produces MEP followed by a period of electromyogram (EMG) silence during voluntary muscle contraction. This period of silence is known as the cortical silent periods (CSP). The phenomenon of the ‘silent period’ refers to a transient decrease in EMG activity evoked during sustained muscle contraction by TMS. While spinal inhibitory mechanisms may be active during the early part (∼50 ms) of the CSP, the later part of this period (> 75 ms) is ascribed to cortical inhibitory mechanisms, probably related to gamma-aminobutyric acid-B (GABAB) receptor activation.7 CSP results in patients with epilepsy have been variable. A longer CSP was found in untreated patients with idiopathic generalized epilepsy (IGE).8 However, a normal CSP was reported in patients after a first-ever generalized seizure, patients with progressive myoclonic epilepsy, juvenile myoclonic epilepsy (JME), and cryptogenic focal epilepsy (FE).9–12 CSP testing has often been conducted in patients with chronic epilepsy taking at least one AED. AEDs have been shown to affect various TMS parameters used to assess cortical excitability,13–17 and accordingly, it is difficult to separate these from any exclusive effect of epilepsy. Only a few studies using small cohorts have been conducted on AED-naïve patients, with conflicting results.
In this study, we investigate whether specific TMS parameters may determine the epilepsy classification and which parameters are responsible for it.
Methods
Subjects
We recruited 148 consecutive epilepsy patients (IGE=38, FE= 110, M:F=77:71, mean age 31.4 ± 12.1 years) who were newly diagnosed with epilepsy when they visited the Epilepsy Clinic at Samsung Medical Center or were AED-free for more than 1 month. We also enrolled 38 age- and gender-matched healthy subjects with no central nervous system (CNS) drug history. The diagnosis of epilepsy was determined by at least two experienced epileptologists from the clinical history, electroencephalographic (EEG), and magnetic resonance imaging (MRI) findings. The determination of an epileptic syndrome was based on the International League Against Epilepsy criteria.18 Only patients with a confirmed diagnosis of epileptic seizures and a normal neurological examination were included. Neither patients nor healthy subjects had taken AEDs or any CNS drug.
Inclusion criteria
Patients were newly diagnosed with epilepsy with no history of AED treatment.
No history of neuroleptic medication or CNS drugs.
Normal neurologic examination.
No history of other neurological or psychiatric disease.
Exclusion criteria
Suspicion of non-epileptic events (e.g., psychogenic or provoked seizures, other paroxysmal events such as syncope, migraine, parasomnia).
Patients with an undetermined epilepsy syndrome.
Exposure to AEDs or CNS drugs prior to the TMS study.
Previous neurosurgical intervention or skull defect.
Cardiac pacemaker or intracranial metallic implants.
Healthy controls
In total, 38 healthy subjects (M:F=18:20, mean age: 29.1 years; range 18–60 years) with no personal or family history of seizures or any other neurologic condition including CNS drug use. Written informed consent form was obtained from each participant, including parental consent from participants younger than 18 years. This study protocol was approved by the Human Investigation Committee of Samsung Medical Center.
Transcranial magnetic stimulation
We used a Rapid 2 magnetic stimulator (Magstim, Whales, UK), which produces a biphasic pulse, and a forced air-cooled circular (90 mm diameter winding) or double 70 mm configuration coil. We evaluated both hemispheres in each group (epilepsy and control groups). During TMS, all participants sat in a comfortable chair in a quiet and cozy room to avoid fear or excessive tension. Intracortical excitability was assessed by paired stimulation at various interstimulus intervals (ISIs) using a Bistim module to connect two stimulators to the coil. We recorded several TMS parameters. The TMS parameters were measured during a seizure-free state of more than 48 h in the patients.
Cortical silent period
The CSP was measured over eight trials at stimulus intensities of 120%, 140%, and 150% of the resting motor threshold (RMT) in moderately active the flexor digitorum indicis (FDI) (at ∼30% of maximum voluntary contraction).19 TMS stimuli were delivered randomly 5 s apart also with eight stimuli at each stimulus intensity. CSP duration was defined in the individual trials from the time of the first turning point of the stimulus-induced MEP to the first recurrence of rectified voluntary EMG activity. The time of the first turning point was determined by the EMG machine. CSP offset time was determined by a single blinded investigator (EYJ). Average CSP duration was calculated for all stimulus intensities.6
Amplitudes of motor evoked potential
Peak-to-peak MEP amplitudes were measured in resting FDI at stimulus intensities of 120%, 140%, and 150% of the RMT. TMS stimuli were delivered randomly 5 s apart with eight stimuli at each stimulus intensity, and average MEP amplitudes were calculated at each intensity
Short interval intracortical inhibition and intra-cortical facilitation
The short interval intracortical inhibition (SICI) was obtained at ISIs of 2, 3, and 5 ms and intracortical facilitation (ICF) at longer inter-stimulus intervals, of 10, 15, and 20 ms, using a protocol described previously.16,20 The conditioning stimulus was set at 80% of the RMT, at which level no change in spinal cord excitability was induced.20 The intensity of the following suprathreshold test stimulus was adjusted to produce MEPs of ∼1.5 mV peak-to peak amplitude at rest for all baseline and effect measurements. Eight trials of single control test stimuli and eight-paired stimuli of each ISI were recorded and delivered 5 s apart in a random order generated by a computer program. The average of eight trials was used to define amplitudes of peak-to-peak MEPs. A conditioned response was defined as the mean amplitude of conditioned responses belonging to the ISI and was expressed as a percentage of the mean amplitude of the unconditioned test responses.
Resting motor threshold
The RMT was defined as the minimum percentage of stimulator output intensity that induced a MEP of at least 50 μV (peak-to-peak amplitude) in FDI muscle in the relaxed state in at least four of eight consecutive trials. RMT was measured in the right and left motor cortices. Surface EMG was recorded from the right or left FDI muscle. An auditory feedback EMG signal was produced to ensure complete voluntary relaxation of the target muscle. Placement of the coil over the motor cortex was performed by finding and marking a scalp site that was optimal in terms of producing MEPs in the FDI muscle. A step width of 1% of the maximum stimulator output was used to determine motor thresholds.
Statistical analysis
The results in IGE patients were subdivided according to hemisphere dominance, assessed by handedness according to the Edinburgh Handedness Inventory. The results in focal epilepsy were also analyzed according to the ipsilateral (to seizure focus) and contralateral hemispheres. This was based on EEG findings, seizure semiology, or both. Differences between the TMS parameters of drug-naïve epilepsy patients and age- and gender-matched normal controls were compared using the independent t-test. The parametric t-test was used to compare normally distributed TMS parameters. Statistical significance was accepted for p values < 0.05.We used repeated-measures analysis of variance to compare RMT, MEP amplitudes, CSP, SICI, and ICF within and among the groups. Each analysis of variance had a between-subjects factor “group” (control vs. IGE or control vs. focal epilepsy) and a within-subject factor “hemisphere” (interhemispheric comparison). Post hoc analysis using a pair-wise paired t-test and Bonferroni correction was used to compare all significant interactions (group × hemisphere). All analyses were performed using SPSS software ver. 18.0 (SPSS Inc., Chicago, IL, USA).
Results
The subjects included 148 epilepsy patients who were drug-naïve or abstained from AED use for more than 1 month as well as 38 healthy controls. The epilepsy patients consisted of IGE (n=38, 25.6%) and FE (n=110, 74.4%) subjects. Based on seizure semiology, EEG, and brain MRI findings, the FE cases were classified into FE-L (epileptogenic focus on the left hemisphere, n=65, 59.0%) and FE-R (focus on the right hemisphere, n=45, 41.0%). The age of seizure onset in the patients was 27.5 ± 9.2 years, and the duration of epilepsy was 3.8 ± 6.1 years.
Cortical silent period and amplitudes of motor-evoked potentials
The mean CSP increased, as expected, with increasing stimulus intensity in both hemispheres in all groups. The mean CSP was longer in both hemispheres of the IGE patients compared with normal controls at all stimulus intensities (p < 0.05; Fig. 1, Table 1). No inter-hemispheric difference in CSP was found (p > 0.05). In FE patients, TMS parameters were compared between 1) ipsilateral hemisphere (IH) to the epileptic focus versus the contralateral hemisphere (CH), 2) IH or CH versus normal controls, and 3) IH or CH versus IGE patients. The mean CSPs were significantly longer in the IH at all intensities (p < 0.001) and in the CH at 120–140% of the RMT (p < 0.05) than in the normal controls (Fig. 2, Table 2). The mean CSP was significantly longer in IH than CH at all intensities (p < 0.05; Fig. 3). Between FE and IGE patients, there was no significant difference in CSP at any stimulus intensity (Fig. 4). The amplitude of MEPs increased as expected, with increasing stimulus intensity in both hemispheres in all groups. The amplitude of MEPs seemed to increase slightly in epilepsy patients compared with healthy controls; however, this was not statistically significant. There was also no significant difference in MEP amplitudes between the FE and IGE groups (Tables 1 and 2).

Cortical silent periods (CSP) in IGE (DH) vs. Control. The mean CSP was longer in dominant hemispheres of IGE patients compared with normal controls at all stimulus intensities.

CSP and MEP amplitudes in IGE group (mean ± SD)
cortical silent periods (CSP) in FE (IH or CH) vs. Control. The mean CSPs were significantly longer in the IH of FE at all intensities than normal controls (p < 0.001) (A). The mean CSPs were significantly longer in the CH of FE at 120–140% of RMT than normal controls (p < 0.05) (B).
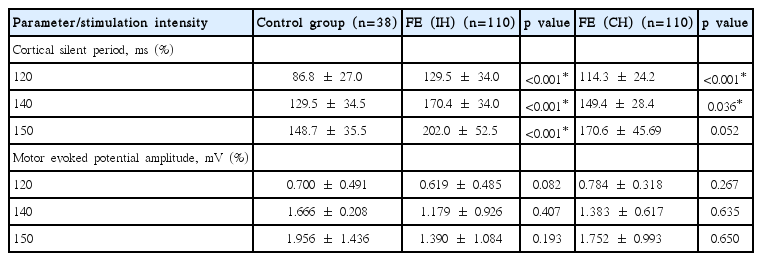
CSP and MEP amplitudes in FE group (mean ± SD)

cortical silent periods (CSP) in FE (IH) vs. FE (CH). The mean CSP was significantly longer in IH than that in CH at all intensities (p < 0.05).
cortical silent periods (CSP)s in each group at all stimulation intensities. Between FE and IGE patients, there was no significant difference of CSP at any stimulus intensity.
Short interval intra-cortical inhibition and intra-cortical facilitation
SICI (MEP inhibition at short ISIs) in the non-dominant hemisphere (NDH) of IGE patients was reduced at 3 ms (p < 0.05), and other SICI in the IGE subgroups seemed to be slightly reduced, although without statistical significance (Table 3). However, we found that SICI was reduced significantly in the IH of FE patients compared with normal controls (p < 0.05; Table 4 and Fig. 5). SICI of CH was reduced at only 3 ms (p < 0.05; Table 4). There was no significant difference in intra-cortical facilitation between the patient and control groups (Table 5).

SICI and ICF in IGE group (mean ± SD)
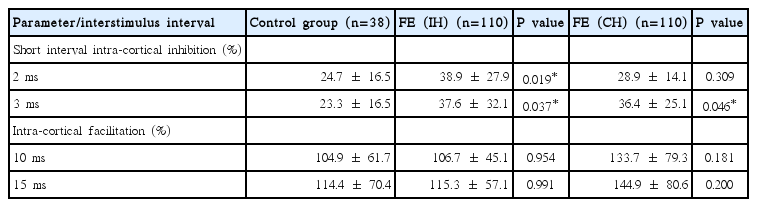
SICI and ICF in FE group (mean ± SD)

SICIs in FE (IH or CH) vs Controls at all stimulus intervals. SICI (MEP inhibition at ISI) was significantly reduced in IH of FE patients compared to normal controls (p < 0.05).

RMT in each group (mean ± SD)
Resting motor thresholds
No significant difference was observed in the RMT between epilepsy patients and normal controls. Only the RMT of the IGE was increased in the NDH compared with the control group (p < 0.05), but there was no difference in the dominant hemisphere (DH) compared with the control group (Table 5). There was a significant interhemispheric difference in these measures.
Discussion
We observed that drug naïve epilepsy patients have both abnormal enhanced cortical inhibitory circuit and cortical hyperexcitability (defected intracortical inhibitory system) and we could measure this abnormal cortical inhibition and excitation balance by TMS parameters that might have lateralizing values. In this study, the CSP duration was prolonged with increasing stimulus intensity in all groups, as expected.21,22 A recent study also confirmed that CSP duration was affected by TMS intensity.23 In the IGE patients, we found that the CSP duration was significantly prolonged in both hemispheres with respect to normal controls at all stimulus intensities, and no inter-hemispheric difference in CSP was found. This finding was similar to those of previous studies, including a recent meta-analysis8,22,24 that suggested the increased CSP reflects a compensatory interictal mechanism, with hyperactivation of inhibitory neuronal circuits counteracting the transition from the interictal to the ictal state.8 In contrast, in a minority of IGE patients,10,25 the reduced CSP could indicate that deficient inhibitory mechanisms underlying this TMS measure are involved in epileptogenesis, therefore, it is reasonable that these distinct pathophysiological substrates bear different weights in different IGE syndromes.22 In FE patients, the mean CSPs were significantly longer in both the IH (to the epileptic focus) and the CH (to the epileptic focus) than in normal controls, but much longer in the IH than the CH at all intensities. These data suggest that an enhanced CSP in patients with FE reflects compensatory interictal phenomena, which may counteract seizure occurrence and the spread of epileptogenic hyperexcitability from the affected hemisphere to the contralateral one.24 In this study, between FE and IGE patients, there was no significant difference in CSP at any stimulus intensity. However, we should consider that epilepsy syndromes can depend on different pathophysiological processes, and subsequently, the CSP (as well as other TMS measures) can be increased or reduced, depending on whether its neural substrate is involved in epileptogenesis or in interictal compensatory phenomena.22 More prominent changes in interictal CSP in the IH of FE indicate there is a lateralized change in balance of cortical excitatory and inhibitory influences confined to the affected hemisphere and this TMS parameter could have the lateralizing value in the FE patients. Concerning CSP, the later part of silent period (> 75 ms) is ascribed to cortical inhibitory mechanisms probably related to GABAB receptor activation.7 In this study we observed that CSP duration was significantly prolonged in epilepsy patients and that could be related with abnormally enhanced GABAB receptor activation. This enhanced CSP in FE patients may reflect compensatory interictal phenomena, which may counteract seizure occurrence and the spread of epileptogenic hyperexcitability. SICI and ICF mainly reflect the activation of inhibitory and excitatory cortical interneuronal circuits by a conditioning TMS pulse.20,26 SICI is likely to be a gamma-aminobutyric acid (GABA)-ergic effect related to GABAA receptors, whereas ICF is a glutamatergic effect.27–29 In patients with cortical myoclonus30 or JME,9,25,31,32 SICI was reduced and ICF was normal. In our IGE patients, SICI in the NDH of IGE patients was reduced, at 3 ms (p < 0.05), and other SICI of the IGE subgroups seemed to be reduced slightly, albeit without statistical significance, which does not completely agree with previous findings.25,31,33 However, this could be the result from different epilepsy syndromes. Patients with JME demonstrated significantly higher levels of cortical excitability compared with those with other types of IGE, differentiating JME from other IGE syndromes.34 In patients with FE, SICI was significantly reduced in the IH (to the epileptic focus) but not the CH, which is similar to previous studies in drug-naïve patients.9,35 These findings suggested that the reduction in SICI was a reflection of the significantly higher excitability related to GABAA-ergic dysfunction in the hemisphere with the epileptic focus, as compared with the contralateral side. Unlikely to CSP changes, we found reduced SICI with no difference of ICF in the IH of drug-naïve FE patients. The SICI is considered to reflect very complex inhibitory activities in the context of the primary motor cortex. The most acknowledged contribution is activation of GABA-ergic cortical inter-neurons, and particularly of GABAA receptor-mediated effects36 but intracortical inhibition is proportional to the dopaminergic, cholinergic and serotonergic tone as well.35 The ICF is thought to be due to complex activation of cortical excitatory inter-neuronal circuits, among which the glutamate-related effects are the most recognized, notably mediated by the N-methyl-D-aspartate receptor.6,27,29 Focal interictal spikes appear to be generated through a brief period of runaway excitation that spreads rapidly through a large local network of neurons that is terminated largely by the activation of inhibitory synaptic conductance mediated by both GABAA and GABAB circuits.9,37 Studies have shown that functionally aberrant GABAA subunits are expressed during the early phases of epilepsy development.38 In these conflict data, we suggested that these TMS parameters could demonstrate noninvasively the major disturbance, altered GABA-ergic function including both GABAA and GABAB circuits in the motor cortex. Especially in the CSP, we could find that change remains localized to the affected hemisphere in patients with focal epilepsy while is widespread and bilateral in patients with IGE. In addition, reduced SICI (MEP inhibition at short ISIs) could have the lateralizing value as well as the prolonged CSP in the FE patients.
We found that the RMT in epilepsy patients was not significantly different from that of healthy controls. We noticed a trend towards a higher RMT in epilepsy patients, but only the RMT of the NDH of the IGE group was significantly higher (p < 0.005). Various TMS studies in epilepsy patients have reported conflicting results, ranging from a normal RMT to lower or higher RMT.3,10,11,39,40 The RMT is believed to reflect the membrane excitability of corticospinal neurons and inter-neurons projecting onto these neurons in the motor cortex, as well as the excitability of motor neurons in the spinal cord.27 In addition to membrane excitability itself, the RMT is related to the activity of neural inputs into pyramidal cells that affect their membrane excitability (i.e., tonic inhibitory and excitatory drives to the cortical output neurons), and provides insights into the efficacy of a chain of synapses from presynaptic cortical neurons to muscles.41 A recent meta-analysis of the RMT in IGE reported that patients with JME have a lower RMT compared with healthy controls, but the difference was not statistically significant in other IGEs. They also reported a trend towards a higher RMT in IGE, which might represent an interictal protective mechanism against the spread or recurrence of seizures.42 Our data were consistent with these previous reports and could also be related to the timing of the TMS study, during a seizure-free state of more than 48 h in the patients. Thus, we suppose that IGE patients might exhibit over-suppression of motor excitability due to hyper excitability of inhibitory circuits as a compensatory mechanism during an interictal state in the early stages of the disease without drug effects. While RMT mainly reflects neuronal membrane excitability, depending on ion channel conductivity, the CSP reflects the activity of intra-cortical inhibitory interneurons in the primary motor cortex, depending on GABAB-ergic intracortical circuits.5,43,44
In conclusion, we found that prolonged CSP and reduced SICI in FE indicate asymmetrically increased interictal cortical inhibition and paradoxically enhanced hyperexcitation in the epileptic hemispheres. These findings may imply a broken or altered balance of cortical inhibitory and excitatory system mainly related with altered GABA-ergic function that is a main characteristic of the epilepsy. Among several TMS parameters, CSP and SICI have a crucial role to lateralize the epileptic hemisphere in FE.
Acknowledgements
This research was supported by Basic Science Research Program through the National Research Foundation of Korea funded by the Ministry of Science, ICT & Future Planning, Republic of Korea (No. 2014 R1A1A3049510) and by Samsung Biomedical Research Institute grant (#OTX0002111).
Notes
Conflict of interest
No conflicts of interest declared.
Author Contributions
EY Joo & SB Hong were involved in acquisition of data. EY Joo, JH Lee and DW Seo were responsible for conception and design of the study, conducted the statistical analysis, and drafted the manuscript. EY Joo has full access to all the data in the study and takes responsibility for the integrity of the data and the accuracy of the data analysis.