Relationship between Hyperventilation-Induced Electroencephalographic Changes and PCO2 Level
Article information
Abstract
Background and Purpose:
We conducted this study to define the relationship between the hyperventilation-induced EEG changes (HV-EEG changes) and PCO2
Methods:
In consecutive EEG recordings of 190 patients, we gathered data on PCO2 during the hyperventilation procedure. The data included baseline PCO2 (B-PCO2), PCO2 after 5 min of hyperventilation (5 min-PCO2), the mean value of the PCO2 (M-PCO2), and the difference between B-PCO2 and 5 min-PCO2 (ΔPCO2). We divided the enrolled patients into two groups by hyperventilation response (response group and no-response group), presence of epilepsy (epileptic group and non-epileptic group) and age (child-adolescent group and adult group) repeatedly. We compared the four variables between the two groups in each pair.
Results:
ΔPCO2 was 14.2±5.0 mmHg (mean±SD) in response group (n=48) and 12.4±5.0 in no-response group (n=142; p=0.033) for all the patients. For adult patients only, 5 min-PCO2 was 24.3±3.4 in response group (n=30) and 26.2±4.6 in no-response group (n=115; p=0.048), and ΔPCO2 was 15.8±4.0 and 12.9±5.0, respectively (p=0.004). In non-epileptic patients, 5min-PCO2 was 23.4±2.2 in response group (n=7) and 26.3±3.8 in no-response group (n=44; p=0.026), and ΔPCO2 was 15.9±4.3 and 12.7±3.9, respectively (p=0.053).
Conclusions:
In adults and non-epileptic patients, ΔPCO2 and 5 min-PCO2 may be crucial to the induction of EEG changes by hyperventilation. PCO2 could be a crucial factor for provoking HV-EEG changes in a limited group of patients.
Introduction
Hyperventilation is an easy and safe procedure for inducing physiological EEG morphologic changes, interictal discharges, and certain seizures.1 Physiologically, the EEG morphologic change consists of a buildup of medium to high amplitude, bisynchronous delta and theta waves and an increase in the amplitude of the theta and alpha waveforms.1 Children show these changes more intensely than adults, especially between the ages of 8 to 12 years.2 In addition to these physiological changes, hyperventilation can also elicit certain clinical seizures, especially in patients with idiopathic generalized epilepsy or symptomatic generalized epilepsy.2
The mechanism of the hyperventilation-induced EEG changes (HV-EEG changes) is still debated.1,3 The hypoxia theory holds that cerebral hypoxia associated with vasoconstriction induced by hyperventilation is an explanation of the cause of these changes.3 But several studies on the change in PCO2 during hyperventilation have raised an objection to this theory.4 They reported that a wide range of PCO2 could induce EEG changes and that the absolute value of the PCO2 was meaningless. As a result, other factors contributing to the HV-EEG changes were introduced. The direct effects of PCO2, cerebral alkalosis, and individual sensitivity to hypoxia, as well as hypoxia itself, all may be part of the mechanism of these EEG changes.3
Although the effects of hyperventilation on the EEG are well-known, there is no standard protocol for hyperventilation; few studies have examined standardization of the hyperventilation procedure.5,6 In one study of the topographical quantitative EEG changes after hyperventilation, the maintenance of the end-tidal PCO2 at 15 mmHg had a greater mean spectral power density than non-standardized hyperventilation.5 A study of hyperventilation in children suggested that maintaining a respiration rate of 30/min and a threefold elevation of the resting expiratory volume for 4 min were the optimal conditions for evoking EEG changes.6 However, there is no widely accepted standardized protocol for hyperventilation. The duration and methods of hyperventilation differ according to the each laboratory, and the prevalence and amount of the HV-EEG changes also vary. The effect of PCO2 in the HV-EEG changes has been investigated using various modalities, including ictal SPECT,2 trans-cranial Doppler,7 and capnography3,4,5,8–11; however, it is not known whether a certain PCO2 level induces the EEG changes and the relationship between the HV-EEG changes and PCO2 level is also unclear.
Although hyperventilation is a useful method for eliciting certain clinical seizures and epileptiform discharges, recent studies of hyperventilation and EEG seems to have focused on seizure induction, and not the basic physiology.8,12,13 We cannot neglect the basic aspects of hyperventilation.
In this study, we conducted trans-nasal PCO2 monitoring during hyperventilation while recording the EEG in consecutive patients. We analyzed level and change of PCO2 and EEG of patients, to define the relationship between PCO2 and HV-EEG changes; the frequency of HV-EEG changes, presence of certain level of PCO2 which could induce HV-EEG changes and other factors of PCO2 which could affect HV-EEG changes.
Methods
Patients
We recorded the EEG with PCO2 monitoring in 217 consecutive patients. Of these, PCO2 data were obtained successfully in 190 patients. The study group consisted of patients with proven epilepsy, as well as non-epileptic patients who underwent an EEG for other reasons, including loss of consciousness, involuntary movements, and headache. In total, 139 patients were diagnosed with various types of epilepsy and were prescribed medication, and the remaining 51 patients had no definitive evidence of clinical seizures. The patients ranged in age from 5 to 65 (32.0±15.7; mean±SD) years. We divided the patients into children-adolescents (n=45, age range: 5–17 years, mean: 13.16±3.46) and adults (n=145, age range: 18–65 years, mean: 37.8 ±13.26) groups using the age boundary of 17 years. By sex, 134 patients were male and 56 were female.
There was no statistically significant difference in the numbers of epileptic patients in the two groups divided by age. There was also no statistically significant difference in the number of children-adolescents patients in the two groups divided by the presence of epilepsy (p=0.321; chi-square test).
EEG recording and PCO2 monitoring
All the EEGs in this study were recorded using a Telefactor Aurora® EEG machine (Grass-Telefactor, Melbourne, Australia) and reviewed using Telefactor Twin 2.6® software. The EEGs were recorded using 21 channels with scalp electrodes according to the international 10–20 system (Fp1, Fp2, F3, F4, C3, C4, P3, P4, O1, O2, T1, T2, F7, F8, T3, T4, T5, T6, Fz, Cz, Pz). The recording time was at least 30 min, including a 5 min hyperventilation period. The hyperventilation procedure involved the maximal respiratory effort of the patient while encouraged by the EEG technician about 40–45/min. The subjects maintained hyperventilation for 5 min consistently. A trans-nasal PCO2 monitoring device (CO2SMO® ETCO2/SpO2 monitor; Novametrix, Wallingford, CT, USA) was used to measure the PCO2 during the hyperventilation period.
Definition of the hyperventilation-induced EEG changes
All recorded EEGs were reviewed visually. We defined the HV-EEG changes as summation of all EEG changes that presented more than at least 10 sec, and consisted of theta and delta induction with amplitude increment. We divided the patients in two groups according to the presence of HV-EEG changes: the response and no-response groups. We also examined the trace for electrical or clinical seizures during the hyperventilation period; no electrical or clinical seizure activity was provoked in the 190 patients.
Data collection and analysis
We used the NovaCARD® data archive system (Novametrix) to collect the PCO2 data recorded during the hyperventilation period. We gathered data on the baseline PCO2 level (B-PCO2), the PCO2 level after 5 min of hyperventilation (5 min-PCO2), and the mean PCO2 level (M-PCO2) for each group. We also determined the change in the PCO2 level (ΔPCO2), which was the difference between the B-PCO2 and 5 min-PCO2. For all the patients, we used SigmaStat® version 2.10 (SPSS Inc., Chicago, IL, USA) to compare the four variables between the response and no-response groups. We also made the same comparisons within the epileptic patients, non-epileptic patients, children-adolescents, and adults groups. The Mann-Whitney U test was used for the comparisons. With normality and equal variance, Student’s t-test was performed. To compare the frequency of the HV-EEG changes between epileptic and non-epileptic patients and between children-adolescents and adult patients, we used chi-square analysis. In all analyses, the statistical significance was set at p<0.05.
Results
Hyperventilation-induced EEG changes
EEG changes were seen in 48 of the 190 patients (25.3%). In the children-adolescents group, 18 of 45 patients (40.0%) had EEG changes. In the adults, 30 of 145 patients (20.7%) exhibited EEG changes (p=0.016; chi-square test). Seven of the 51 non-epileptic patients (13.7%) showed EEG changes versus 41 of the 139 epileptic patients (29.5%) (p=0.042; chi-square test).
Hyperventilation-induced EEG changes and PCO2 level
The values of the variables for all enrolled patients
The B-PCO2 was 39.8±3.7 mmHg in the response group and 39.3±3.6 mmHg in the no-response group (p=0.353). The 5 min-PCO2 was 25.6±4.5 and 26.9±5.1 mmHg (p=0.124); the M-PCO2 was 30.3±3.9 and 31.2±4.0 mmHg (p=0.200); and the ΔPCO2 was 14.2±5.0 and 12.4±5.0 mmHg (p=0.033), respectively. Only the ΔPCO2 differed significantly between the response and no-response groups (Table 1).
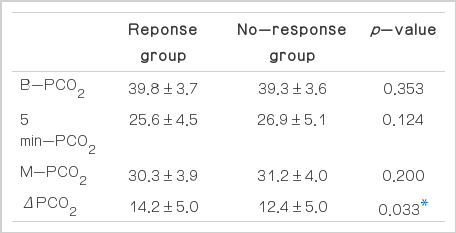
Values of the PCO2 parameters for all enrolled patients
The values of the variables in the subgroups according to age
In children-adolescents group, none of the variables differed significantly between the response and no-response groups. The B-PCO2 was 39.3±3.4 and 40.0±3.7 mmHg (p=0.490); the 5 min-PCO2 was 27.7±5.3 and 29.6±6.3 mmHg (p = 0.298); the M-PCO2 was 32.1±4.3 and 33.0±4.9 mmHg (p=0.494); and the ΔPCO2 was 11.6±5.5 and 10.4±4.8 mmHg (p=0.465), respectively.
In the adults group, the values of the 5 min-PCO2 and ΔPCO2 differed significantly between the response and no-response groups. The B-PCO2 was 40.0±3.9 and 39.1±3.6 mmHg (p=0.117); the 5 min-PCO2 was 24.3±3.4 and 26.2±4.6 mmHg (p=0.048); the M-PCO2 was 29.2±3.3 and 30.7±3.7 mmHg (p=0.075); and the ΔPCO2 was 15.8±4.0 and 12.9±5.0 mmHg (p=0.004), respectively (Table 2).

Values of the PCO2 parameters according to age
The values of the variables in subgroups according to the presence of epilepsy
In the epileptic group, there was no statistically significant difference in any variable between the response and no-response groups. The B-PCO2 was 39.8±3.8 and 39.4±3.9 mmHg (p=0.468); the 5 min-PCO2 was 25.9±4.7 and 27.1±5.6 mmHg (p=0.343); the M-PCO2 was 30.5±4.1 and 31.5±4.3 mmHg (p=0.280); and the Δ PCO2 was 13.9±5.1 and 12.3±5.5 mmHg (p=0.101), respectively.
In the non-epileptic group, the value of the 5 min-PCO2 differed significantly between the response and no-response groups. The B-PCO2 was 39.3±3.6 and 39.0±3.0 mmHg (p=0.833); the 5 min-PCO2 was 23.4±2.2 and 26.3±3.8 mmHg (p=0.026); the M-PCO2 was 28.9±2.5 and 30.5 ± 3.3 mmHg (p=0.205); and the ΔPCO2 was 15.9±4.3 and 12.7±3.9 (p=0.053), respectively (Table 3).
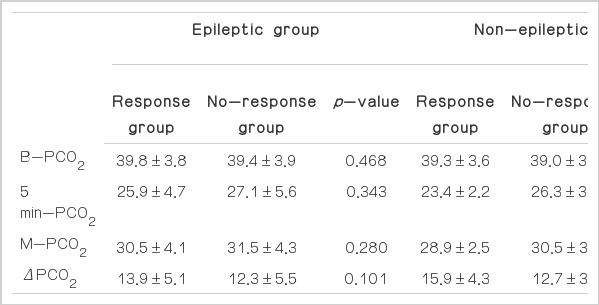
Values of the PCO2 parameters according to the presence/absence of epilepsy
Discussion
In this study, we determined three major findings concerning the HV-EEG changes and PCO2. First, hyperventilation-induced EEG changes were more frequently observed in the children-adolescents group than in the adults group and in the epileptic group than in the non-epileptic group. Second, the 5 min-PCO2 differed significantly in responders in the adults and non-epileptic patients groups. Finally, the ΔPCO2 had a significant effect on inducing HV-EEG changes in all the enrolled patients and the adults group.
It is widely known that children show these responses more frequently, but the prevalence of the responses has varied from study to study. The most widely accepted data on the prevalence of HV-EEG changes were reported by Gibbs et al.9 in 1943. They studied hyperventilation and EEG responses in 2,281 normal controls and 1,107 epileptic patients and reported that a response to varying degrees was seen more in children than in adults and in epileptic patients more than in the normal population. They reported that 697 of the 1,027 normal controls and epileptic patients under the age of 20 years showed an EEG response (67.9%), while 807 of 2,391 participants over 20 years of age showed EEG changes (33.8%). In addition, they reported that 763 of 1,107 epileptic patients (68.9%) and 751 of 2,281 normal controls showed these responses (32.5%). In our study, the prevalence was 40% in the children-adolescents group, 20.7% in the adults group, 29.5% in the epileptic group, and 13.7% in the non-epileptic group. Although these prevalences were lower than those of Gibbs et al., they showed the same tendency, i.e., young individuals and epileptic patients showed HV-EEG changes more frequently. We believe that the lower prevalence in our study was mainly due to differences in the hyperventilation protocol. The protocol Gibbs et al. used for hyperventilation was stricter, and required approximately 50 deep breaths/min for 2 min. Because we monitored the PCO2 level, we thought that a strict hyperventilation protocol may not be needed in our study.
The end-tidal PCO2 level after voluntary hyperventilation is reported to be critical in inducing EEG changes.5,6 This provided strong support for the hypoxia theory concerning the HV-EEG changes.3 Because other studies reported that a wide range of PCO2 could induce these responses,4 investigators no longer focused on attempts to determine the threshold PCO2 level inducing HV-EEG changes. We found a statistically significant effect of the 5 min-PCO2 on HV-EEG changes in the adults and non-epileptic patients groups. However, a range of PCO2 induced EEG changes in our study, as previously reported. We were unable to find a critical level that induced EEG changes. We believe finding that a wide range of PCO2 levels induced HV-EEG changes is more meaningful than finding that the 5 min-PCO2 was significantly effective in inducing HV-EEG changes.
We think that the most valuable finding of our study concerns the ΔPCO2. The ΔPCO2 had a significant relationship with whether there was a response for the patients as a whole and the adults group and a tendency in the non-epileptic patients group (p=0.053). This implies that it is the change in the PCO2 level between before and after hyperventilation that is important for inducing EEG changes, and not the absolute PCO2 level. To our knowledge, this is the first study to report that the change in the PCO2 level is more associated with EEG changes.
We also believe that it is meaningful that the 5 min-PCO2 and ΔPCO2 were statistically significant in the adults and non-epileptic patients groups. The PCO2 did not appear to make an important contribution to the EEG changes in the children-adolescents and epileptic patients groups. We suggest that factors other than the PCO2 are more important for inducing the HV-EEG changes in these groups. There are reports that the cerebrovascular responsiveness to CO2 varies with age, and that the difference in the EEG response to hyperventilation in children and adults may result from differences in decreased cerebral blood flow and sensitivity of the CNS to the change in cerebral blood flow.10,11 This may explain why EEG changes were more common in the children-adolescents group, but not in the epileptic patients group. In addition, we think that the well-known neuronal hyperplasticity, immaturity, or excitability of those patients is a plausible explanation for the increase in EEG changes versus the adults and non-epileptic patients groups.
We also analyzed each of the PCO2 variables within the adults group. Regardless of whether they had epilepsy, the ΔPCO2 was the only statistically significant contributing factor for HV-EEG changes. In the adults-epileptic group, ΔPCO2 was 15.45±4.1 mmHg in the response group and 13.1±5.5 mmHg in the no-response group (p=0.045). In the adults-non-epileptic group, ΔPCO2 was 17.8±2.2 and 12.4±3.7 mmHg in the respective groups (p=0.007).
Conclusions
PCO2 may have a critical role in inducing EEG changes in adults and non-epileptic patients. PCO2 monitoring according to the change from the baseline PCO2 level may be important for properly provoking the HV-EEG changes for a limited group of patients.